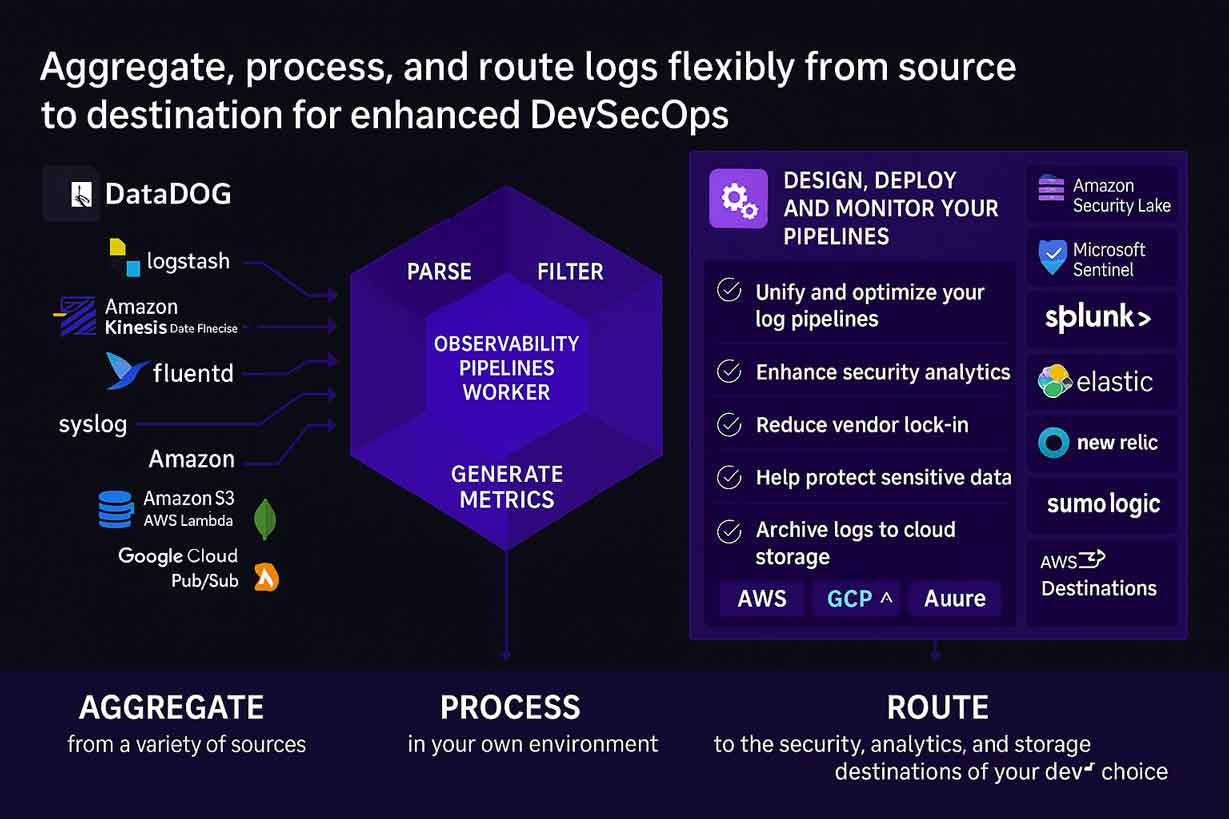
- Centralized Log Management – Collect and analyze logs from various sources.
- Ingest Pipelines – Process and enrich logs before indexing them in Elasticsearch.
- Live Tail & Filtering – View real-time log streams with filtering options.
- Kibana Logs UI – Structured search and analysis of logs in a dedicated interface.
- Log Rate Alerts – Create basic alerts based on log ingestion volume.
Observability Features in the Elasticsearch Basic License
Logs Monitoring
Metrics Monitoring
- Infrastructure Monitoring – Collect and visualize CPU, memory, disk, and network metrics.
- Host & System Metrics – Use Elastic Agent to track host-level performance.
- Pre-built Dashboards – Default metric dashboards in Kibana for Linux, Windows, Kubernetes, etc.
- Basic Anomaly Detection – Identify deviations in system metrics with Machine Learning (limited to trial for full ML).
Application Performance Monitoring (APM)
- Distributed Tracing – Capture and analyze request traces across services.
- Service Maps – Visualize relationships between microservices.
- Error Tracking – Identify application exceptions and slow transactions.
- Basic APM Agents – Java, Node.js, Python, .NET, Ruby, Go, etc.
Uptime & Synthetic Monitoring
- Ping & Heartbeat Monitoring – Monitor endpoint availability with Heartbeat.
- Basic Uptime Dashboards – View response times, latency, and service health.
Security & Role-Based Access Control (RBAC)
- TLS Encryption – Secure communication within the Elastic Stack.
- Role-Based Access Control (Basic Level) – Define user roles and permissions.
Dashboard Preference
- Grafana or Kibana


